
Sop Blaming the Cut Off Grade
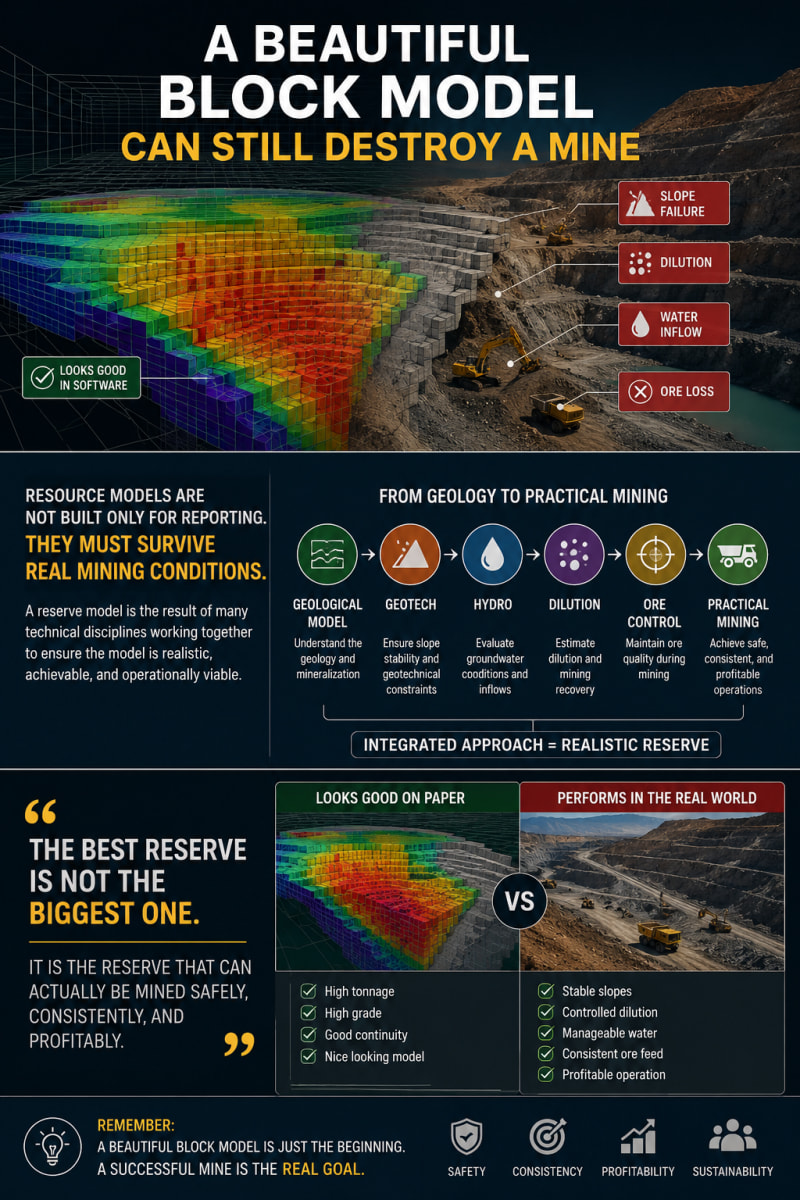
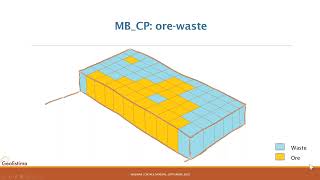
STOP BLAMING THE CUT-OFF GRADE In many technical reviews, discussions often focus on cut-off grades, pit optimization, reserve changes, or project economics. However, these outcomes are merely the final products of a much longer chain of geological assumptions. A cut-off grade does not create value. It only filters value from the model that already exists. Before reserve statements are published, before pit shells are generated, and before economic scenarios are evaluated, fundamental decisions have already been made regarding: • Geological domaining • Spatial continuity assumptions • Variogram interpretation- • Search strategy and estimation parameters • Grade distribution modeling Two competent professionals can start with the same drillhole dataset, use the same software, apply the same cut-off grade, and still arrive at different reserve outcomes. Why? Because geological interpretation drives the model long before economic optimization begins. The greatest risk in resource estimation is often not the estimation algorithm itself, but the assumptions used to represent geological reality. As resource professionals, our responsibility is not simply to generate models—it is to ensure that the geological understanding behind those models is robust, transparent, and defensible. Data is what we have. Geology is how we understand it. The model is how we quantify it. Value is what we create with it. #Mining #Geology #ResourceEstimation #Geostatistics #Variogram #CutOffGrade #MineralResources #OreReserve #MiningEngineering #ResourceGeology #GeologicalModeling #Kriging #MinePlanning #MiningValueChain #Zvenia