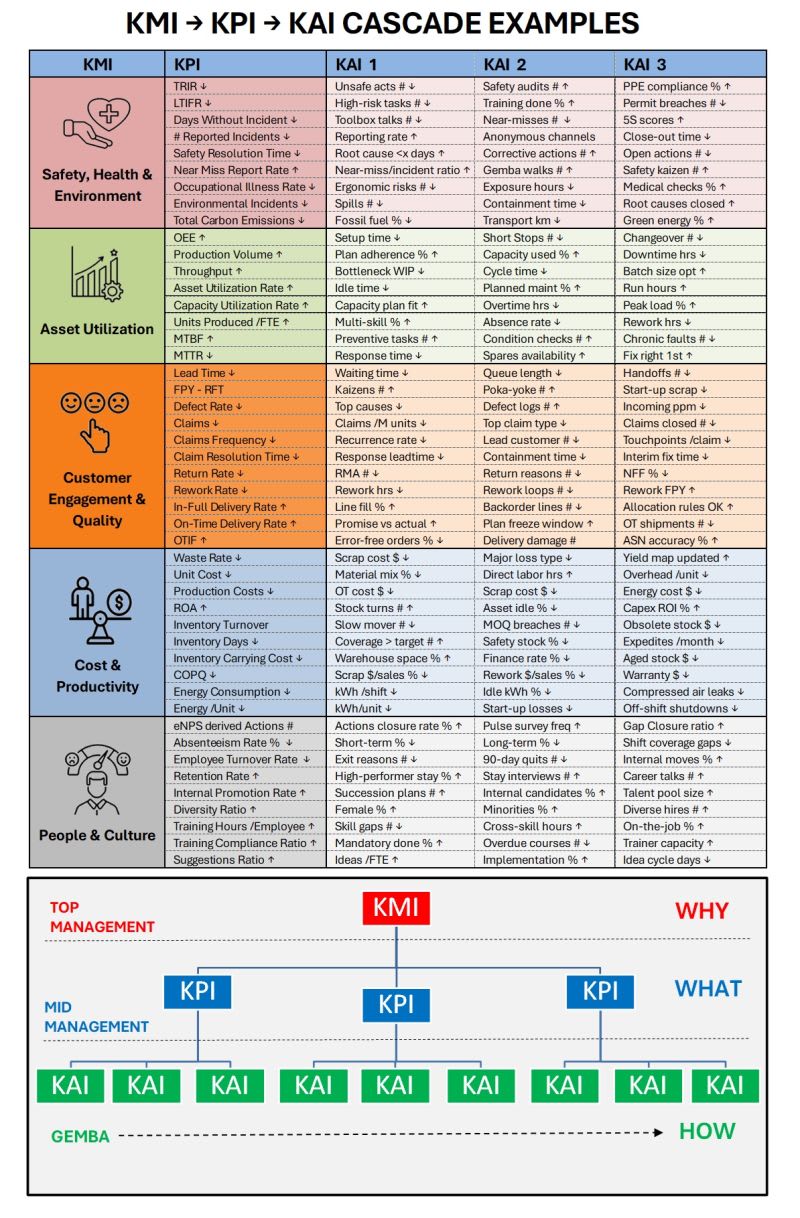
Posts Header

18 Performance levels

Focuses on performance frameworks, maturity models, and operational excellence.

Content on KPIs, performance levels, master plans, and continuous improvement.

Emin Tagiyev
Mining Engineering student at SOCAR 16/10/2025

Maximizing Output and Efficiency in Q4 Operations

A Q4 Production Optimization Project built on *A Multi-Objective Optimization Model Using Improved NSGA-II for Optimizing Metal Mines Production Process* aims to push the mine’s existing system to its maximum potential in the final quarter of the year. This approach focuses on short-term but high-impact improvements that can increase production efficiency, profit, and resource utilization using real operational data. The study from the **Huogeqi Copper Mine** (published in *Processes, MDPI*) provides a solid framework for such optimization. It defines three critical decision variables: **geological cut-off grade, minimum industrial grade**, and **loss ratio**—factors that directly influence economic benefit and resource efficiency. The improved **NSGA-II (Non-dominated Sorting Genetic Algorithm II)** algorithm is used to process large datasets and find the best trade-offs between two main objectives: **maximizing profit** and **improving resource utilization**. Unlike traditional single-objective methods, NSGA-II creates a **Pareto front**, a set of optimal solutions that show how one objective can improve without significantly worsening the other. The study revealed that small, precise adjustments in mine parameters could increase profit by **about 2.99%** and resource utilization by **around 2.64%** compared to the mine’s actual performance. This proves that optimization during Q4 doesn’t require major capital investment—just smarter decision-making. In practical Q4 operations, engineers and managers can apply the same method. They start by gathering current mine data—production rates, grades, energy use, and equipment performance. Then, using the optimization model, they test various scenarios. For example, slightly **lowering the cut-off grade** can bring more ore into the mill if processing costs are under control. Adjusting the **industrial grade** threshold ensures the plant processes material at the best efficiency, while optimizing the **loss ratio** helps reduce wasted ore in extraction or processing. The NSGA-II algorithm helps compare all these possibilities and rank them based on performance impact. In **underground mining**, this approach can optimize stope sequencing, ventilation distribution, and mucking cycles to achieve smoother operations and higher tonnage. In **open-pit mining**, it can optimize haul road gradients, bench design, and truck dispatching to cut down idle time and energy use. The algorithm’s adaptability means it can simulate both short-term (daily or weekly) and long-term (quarterly or yearly) targets, making it ideal for Q4 where fast results matter most. The key strength of the NSGA-II-based optimization is its ability to process conflicting objectives at once—like increasing output without compromising sustainability or overusing equipment. By applying it in Q4, mine planners can quickly identify where the system is underperforming and implement changes that produce measurable improvements before the year closes. This makes it not only a performance-boosting project but also a **strategic preparation tool for the next year’s operational plan**. Ultimately, a Q4 Production Optimization Project following this model uses real data, computational intelligence, and practical engineering to transform end-of-year pressure into measurable gains. It enhances the mine’s economic performance, ensures better resource utilization, and supports long-term sustainability goals—all while keeping within the constraints of existing resources and time. The improved NSGA-II framework acts as a decision-support tool that shows which levers to pull and how far, giving managers clear direction on where the greatest return can be achieved in the shortest possible time.

ZVENIA Mining
Corporate at ZVENIA 25/06/2025

5 Layers of Operational Excellence

90% of companies stall before they scale. Not because the market shifted. Not because the team isn’t capable. And definitely not because of a lack of vision. They stall because their operations can’t keep up with their growth. I’ve seen it over and over. The CEO is still making too many decisions. Processes live in people’s heads. Everyone’s working hard, but execution is inconsistent. So the team starts spinning. Firefighting replaces focus. And big goals turn into reactive checklists. When that happens, the fix isn’t more hustle. It’s operational discipline. But here’s the part most people miss: Operational excellence isn’t one big change. It’s a layered process. Built step by step. You start with standardization. Create one clear way to do the work. No more “everyone has their own method.” Then you move to automation. Eliminate repetitive tasks. Free up time for deeper work. Next comes measurement. Track the right numbers. Make them visible. Let the data guide your decisions. Then, layer in continuous improvement. Small weekly fixes. Fast iterations. Constant learning. Only then are you ready for real innovation. Not chaos disguised as creativity. Bold ideas that stick, scale, and move the business forward. This isn’t a theory. It’s how strong, sustainable companies actually scale. From startups to 8-figure teams, the pattern is the same. Build the layers in order. Tighten the engine before you step on the gas.

Source: Credit to Eric Partaker
5 Layers of Operational Excellence
ZVENIA Mining
Corporate at ZVENIA 10/05/2025

Como Estas Estructurando la EDT de tu Proyecto?

¿𝗖𝗢́𝗠𝗢 𝗘𝗦𝗧𝗔́𝗦 𝗘𝗦𝗧𝗥𝗨𝗖𝗧𝗨𝗥𝗔𝗡𝗗𝗢 𝗟𝗔 𝗘𝗗𝗧 𝗗𝗘 𝗧𝗨 𝗣𝗥𝗢𝗬𝗘𝗖𝗧𝗢? Una EDT (Estructura Desagregada del Trabajo) mal organizada puede complicar todo: la planificación, el control, los reportes y hasta los reclamos. Pero si eliges correctamente su estructura, puedes facilitar la gestión del alcance, los costos y los entregables desde el inicio. En esta infografía te muestro 5 formas efectivas de estructurar la EDT según el tipo de proyecto de construcción: ✔️ Por fases del proyecto (EPC) ✔️ Por áreas físicas ✔️ Por fases específicas ✔️ Por disciplinas técnicas ✔️ Por sistemas constructivos 📌 Cada una tiene su aplicación ideal. La clave está en adaptar la EDT a la lógica real del proyecto, no al revés.

Source: Credit to Arnaldo Gonzalez
Como Estas Estructurando la EDT de tu Proyecto?
ZVENIA Mining
Corporate at ZVENIA 25/04/2025

Daily Management System (DMS) / Asakai

Daily Management System (DMS) or in Japanese Asakai is a structured approach to managing day-to-day operations that focuses on continuous improvement and loss (muda) reduction. Definition of DMS/Asakai : A Daily Management System is a set of practices and tools that enable companies to: 1️⃣ Monitor performance daily 2️⃣ Identify areas for improvement 3️⃣ Take corrective actions quickly 4️⃣ Align KPI’s w/ operational execution 5️⃣ Standardize management processes 6️⃣ Establish standard work 7️⃣ Foster a culture of continuous improvement DMS/Asakai is typically executed through a tiered structure: ➡️ Tier 1 (Team Level): - Daily huddles (5-15 minutes) at the start of each shift - Review of key performance indicators (KPIs) - Discussion of issues and quick problem-solving ➡️ Tier 2 (Supervisory Level): - Daily meetings (15-30 minutes) with team leaders - Review of escalated issues from Tier 1 - Coordination of cross-functional problem-solving ➡️ Tier 3 (Management Level): - Daily meetings (30-45 minutes) with supervisors and managers - Review overall performance and strategic alignment - DMS/Asakai Actions follow up - Review and decision making for escalated issues from Tier 1-2 - Resource allocation and improvement initiatives follow up Key components ✅ Visual management boards displaying KPIs and action items ✅ Standard work for leaders at each level ✅ Gemba walks to observe processes and identify improvement opportunities ✅ Problem-solving methodologies (Root Cause Analysis) ✅ Escalation processes for unresolved issues How DMS/Asakai helps ☑️ Enhances equipment reliability by quickly identifying and addressing maintenance issues ☑️ Improves overall equipment effectiveness (OEE) through daily monitoring and rapid problem-solving ☑️ Reduces unplanned downtime by promoting proactive maintenance ☑️ Increases employee engagement and ownership in continuous improvement efforts ☑️ Aligns daily activities with strategic goals, ensuring focus on critical areas ☑️ Facilitates knowledge sharing and best practice adoption across the organization ☑️ Promotes a culture of accountability and data-driven decision-making By implementing a robust Daily Management System, companies can sustain their performance, driving operational excellence and continuous improvement throughout the enterprise. *Below dash is just an example, details/content may vary based on company metrics/strategic priorities.

Source: Credit to Alper Ozel
Daily Management System (DMS) / Asakai
ZVENIA Mining
Corporate at ZVENIA 31/03/2025

Risk Priority Number (RPN)

RPN is a numerical score used in Failure Mode and Effects Analysis (FMEA) to evaluate and prioritize risks associated with potential failure modes of a product or process. It helps teams focus on the most critical risks that need to be addressed. 🔢 Formula for RPN: RPN = Severity (S) × Occurrence (O) × Detection (D) -Severity (S): The potential impact of a failure. -Occurrence (O): The likelihood of the failure occurring. -Detection (D): The ability to detect the failure before it reaches the customer. Each of these factors is rated on a scale (usually 1 to 10), and the RPN score is the product of these ratings. ⚖️ Prioritizing Risk by 3 Factors: -Severity: How severe the failure would be. -Occurrence: The likelihood of the failure happening. -Detection: How likely the failure will be detected before it affects the customer. 📊 Risk Matrix: A Risk Matrix helps visualize and prioritize risks based on their Severity and Occurrence ratings, while the Detection rating influences how proactive we need to be in addressing those risks. 🔴 Color Coding in Risk Matrix: -Red: High risk, immediate action needed. -Yellow: Moderate risk, requires attention. -Green: Low risk, monitoring required. ✅ Benefits of RPN Matrix: -Provides a systematic way to evaluate and prioritize risks. -Helps allocate resources more effectively by focusing on the most critical risks. -Enhances decision-making by providing clear risk ratings. ⚠️ Disadvantages of RPN: -RPN does not always reflect the true level of risk, especially when factors like severity are not accurately considered. -Two failure modes with the same RPN may require different actions. -Over-reliance on RPN can lead to missing out on other critical aspects of risk. 🔑 Recommendations: - Combine RPN with Severity, Occurrence, and Detection ratings for a more accurate risk prioritization. - Use tools like FMECA for a more detailed and comprehensive risk analysis. Regularly update risk ratings to reflect new data and changes in operational conditions. Source: https://www.linkedin.com/in/govind-tiwari-phd/

Source: Credit to Govind Tiwari
Risk Priority Number (RPN)
ZVENIA Mining
Corporate at ZVENIA 15/03/2025

¿Sabías que los pequeños cambios pueden generar grandes resultados?

El Método Kaizen es una filosofía de mejora continua que ha transformado la forma en que las empresas optimizan sus procesos y mejoran la calidad. 🔍 1. Identifica Oportunidades de Mejora: Revisa tus procesos actuales y detecta dónde puedes optimizar. 👥 2. Conforma un Equipo de Trabajo: Involucra a todos los que participan en el proceso para obtener ideas valiosas. 📊 3. Evalúa la Situación Actual:Analiza cómo se realizan las tareas hoy en día para comprender el flujo de trabajo. 💡 4. Desarrolla Soluciones Innovadoras: Prioriza ideas simples y rápidas de implementar para mejorar el proceso. ⚙️ 5. Implementa el Cambio: Asegúrate de que todo el equipo esté informado y capacitado en los nuevos procedimientos. 📈 6. Monitorea y Evalúa:Observa el impacto de los cambios y ajusta según sea necesario. 🔄 7. Estandariza y Repite: Si los cambios han sido exitosos, estandariza y sigue buscando nuevas oportunidades de mejora. La clave está en la constancia y en involucrar a todos los niveles de la organización. ¡Cada pequeño paso cuenta hacia un gran cambio!

Source: Credit to Andrés Santacruz
¿Sabías que los pequeños cambios pueden generar grandes resultados?
ZVENIA Mining
Corporate at ZVENIA 26/02/2025

12 pasos para lograr un KPI perfecto

¿Sabías que los KPIs (Key Performance Indicators) son esenciales para el éxito empresarial? 🤔📈💼 Son métricas clave que permiten medir el rendimiento y tomar decisiones estratégicas. Sin ellos, sería imposible saber si se están alcanzando los objetivos o si es necesario ajustar la estrategia. 📊 ¿Por qué son tan importantes los KPIs? ✔️ Evalúan el progreso hacia los objetivos. ✔️ Identifican áreas de mejora y oportunidades de crecimiento. ✔️ Permiten monitorear el rendimiento del equipo. ✔️ Ayudan a mantener el enfoque en lo que realmente importa. 🔹 12 pasos para un KPI efectivo 🟢 Nivel Básico: 1️⃣ Definir el nombre del KPI. 2️⃣ Alinear el KPI con un objetivo estratégico. 3️⃣ Establecer el valor, referencia y meta. 4️⃣ Diseñar el proceso de recopilación de datos. 🔵 Nivel Experto 5️⃣ Identificar indicadores clave. 6️⃣ Definir el peso del KPI. 7️⃣ Acordar la frecuencia de actualización. 8️⃣ Establecer la fecha de caducidad. 9️⃣ Calcular el costo de seguimiento. 🔟 Asignar roles y responsabilidades. 1️⃣1️⃣ Definir escenarios de uso. 1️⃣2️⃣ Analizar la diferencia entre proyección y realidad.

Source: Credit to Felipe Israel González Lastré
12 pasos para lograr un KPI perfecto
ZVENIA Mining
Corporate at ZVENIA 24/01/2025

Most change fails in some way or another

Here’s why (and how to fix it) ⬇️ Why does most change fail? It’s not because people resist change. It’s because leaders miss one (or more) critical ingredients: ❌ No vision? The team doesn’t know where they’re headed - causing confusion. ❌ No skills? People feel overwhelmed and anxious about their ability to deliver. ❌ No incentives? Without clear motivation, resistance builds quickly. ❌ No resources? Frustration sets in when people don’t have what they need. ❌ No action plan? You’ll see false starts and repeated mistakes. But when you get all these factors right, change becomes possible: ✅ A clear vision inspires the team and aligns their efforts. ✅ Building the right skills empowers people to contribute effectively. ✅ Meaningful incentives keep everyone motivated and engaged. ✅ Providing the necessary resources ensures a smooth path forward. ✅ A strong action plan keeps the team focused and on track. Change isn’t about luck - it’s about preparation and execution. 🧠 Remember; without all five pieces, even the best ideas will fail to stick. What’s your biggest challenge when driving change?

Source: Credit to Sean McPheat
Most change fails in some way or another
ZVENIA Mining
Corporate at ZVENIA 25/10/2024

50 Business Diagrams for Strategic Planning (56 pages)

🌟 Boost Your Strategic Planning with Essential Business Diagrams 🌟 In today's dynamic business environment, having the right tools is key to making informed decisions. 📊 Whether you’re managing projects, enhancing processes, or optimizing business strategies, having a visual aid can make all the difference! Here are some must-have business diagrams for strategic planning and analysis: Affinity Diagram: Perfect for organizing ideas from brainstorming sessions and identifying patterns. Decision Tree: Helps break down complex problems into manageable steps, leading to optimal decision-making. Value Stream Map: Ideal for visualizing and improving the flow of materials and information in your processes. SWOT Analysis: An essential tool for identifying your business’s strengths, weaknesses, opportunities, and threats. PEST Analysis: Analyze the external macro-environment factors to help your business stay ahead of the curve. Visual tools like these not only streamline your decision-making process but also foster collaboration and innovation within teams. Want to make smarter, data-driven decisions? Start leveraging these business analysis tools today! Source: Mohamed Mohamed Hossam, FMVA®, FTIP™, MBA, PFAD

Source: Credit to Creately
ZVENIA Mining
Corporate at ZVENIA 01/10/2024

L’essentiel du tableau de bord (255 pages)

=> Une méthode de conception du tableau de bord en 5 étapes et 15 outils. => Les clés pour construire un tableau de bord avec Microsoft Excel en 5 temps et 15 fi ches pratiques. Toutes les versions Excel 2003, 2007, 2010 et 2013 sont prises en charge. => Tous les exemples, ainsi qu’un tableau de bord cadre complet, sont disponibles sur le site dédié de l’auteur (www.tableau-de-bord.org). Chaque chapitre est directement relié au site dédié : vous pourrez y consulter les compléments, les références (livres et sites) et les mises à jour. La méthode proposée reprend les principes les plus récents de conception des tableaux de bord pour les adapter aux besoins des managers. Rapidité, simplicité et faible coût de réalisation en sont les priorités. La première partie de cet ouvrage développe concrètement, avec exemples à l’appui, les phases fondamentales de la conception d’un tableau de bord e¬ cace : défi nition des axes de progrès, identifi cation des indicateurs clés, composition des écrans. La seconde partie est orientée réalisation. Les fonctionnalités de Microsoft Excel nécessaires à la réalisation sont présentées et expliquées. Nul besoin d’être un expert, ce livre vous guide pas à pas pour réaliser votre tableau de bord de pilotage opérationnel. Source: MAHDI B.

Source: Credits to Alain Fernandez
ZVENIA Mining
Corporate at ZVENIA 01/10/2024

Project Manager’s Book of Forms (265 pages)

A Project Manager’s Book of Forms is designed to be a companion to A Guide to the Project Management Body of Knowledge (PMBOK ® Guide) – Sixth Edition. The purpose is to present the information from the PMBOK ® Guide – Sixth Edition in a set of forms so that project managers can readily apply the concepts and practices described in the PMBOK ® Guide to their projects. The PMBOK ® Guide identifi es that subset of the project management body of knowledge generally recognized as good practice. It does not describe how to apply those practices, nor does it provide a vehicle for transferring that knowledge into practice. This Book of Forms will assist project managers in applying information presented in the PMBOK ® Guide to project documentation. The Book of Forms does not teach project management concepts or describe how to apply project management techniques. Textbooks and classes can fulfi ll those needs. This book provides an easy way to apply good practices to projects. Source: Saeed Baqader

Source: Credits to Cynthia Snyder Dionisio
ZVENIA Mining
Corporate at ZVENIA 18/09/2024

Dashboard Overload

=> A Noisy Dashboard Makes for a Silent Strategy With so much data at our fingertips and endless analytics tools at our disposal, it can be easy to become overwhelmed and paralyzed by the sheer volume of information. Businesses are constantly being told that they need to measure their performance, but when everything becomes a KPI, the actionable insights become lost in the noise. Instead of moving forward with confidence, companies often freeze, unsure of where to focus their attention. Too many metrics lead to confusion, not clarity, making it difficult to stay on track. We’ve probably all heard the expression (often wrongly attributed to Peter Drucker), “If you can't measure it, you can't manage it.” While there’s truth in that statement, the reality is far more complex. What you choose to measure will dictate your focus, your resources, and ultimately, your success. Here are the five biggest mistakes companies make when selecting KPIs and, more importantly, specific tips to avoid falling into these traps. 1. Measuring What’s Easy, Not What’s Important The Problem: Raise your hand if you’ve ever picked a KPI because it was easy to track. Don’t worry, you’re not alone. Many businesses fall into the trap of measuring what’s convenient instead of what’s critical. Just because you have mountains of data at your fingertips doesn’t mean it’s all worth tracking. For example, tracking website visits? Fun. But is it telling you how engaged your audience really is? Tips: Start with Objectives, Not Data: Begin by defining your strategic goals and then work backward to determine what data you need. Don’t let the availability of data dictate what you measure. Focus on Actionable Metrics: Ask yourself, “If this metric changes, can we take action based on it?” If the answer is no, it’s not a useful KPI. Limit KPIs to Key Priorities: Focus on a few high-impact KPIs that are directly aligned with your business goals, rather than trying to track everything. The fewer KPIs you have, the more focused and actionable your strategy will be. Test for Impact: Before fully adopting a new KPI, run a pilot to see if it drives valuable insights. If not, discard it and try another. 2. Getting Too Cozy with Lagging Indicators The Problem: We all love a good success story, but when it comes to KPIs, focusing only on what’s already happened—those lagging indicators—makes you a bit of a historian. While it’s nice to know your revenue last quarter, wouldn’t you rather know how you’re shaping up for the next one? Lagging indicators are safe and cozy because they give you clear results, but they also lull you into a false sense of security. Tips: Incorporate Leading Indicators: Use a mix of leading and lagging indicators. Leading indicators, such as customer engagement or sales pipeline metrics, give you insights into future performance and can help you make proactive adjustments. Balance Short-Term and Long-Term: Select leading indicators that can inform immediate actions (like the number of sales calls made) as well as long-term results (like customer retention or product development milestones). Track Trends, Not Just Snapshots: Set up tools that allow you to monitor trends in leading indicators over time. This will help you anticipate changes and respond before lagging indicators signal trouble. Automate Alerts: Implement tools that notify you when leading indicators deviate from expected patterns, allowing for quicker course corrections. 3. KPIs: Disconnected from Reality (and Strategy) The Problem: Have you ever been on a road trip with no destination in mind? That’s what happens when your KPIs don’t align with your business strategy. You’re measuring things, sure, but none of them are helping you get closer to where you want to be. When KPIs aren’t tied to what the business is trying to achieve, you risk losing focus and wasting resources on activities that don’t contribute to long-term success. Tips: Tie Every KPI to a Goal: Every KPI should be explicitly linked to a business objective. For example, if the goal is to increase customer loyalty, a useful KPI might be the Net Promoter Score (NPS). If a KPI doesn’t support a goal, it doesn’t belong on your dashboard. Use Strategic Mapping: Develop a strategy map that clearly links KPIs at different levels of the organization to the overarching business strategy. This ensures alignment from the executive level down to individual teams. Regularly Review Alignment: Set up quarterly or annual reviews to ensure that your KPIs still align with evolving business objectives. As strategies change, your KPIs should evolve to reflect new priorities. Communicate the “Why” to Teams: Make sure that everyone in your organization understands how their KPIs connect to the broader strategy. This alignment fosters accountability and ensures that everyone is moving in the same direction. 4. Turning KPIs Into Personal Incentive Traps The Problem: There’s nothing wrong with rewarding employees for hitting KPIs, but when KPIs become too linked to personal incentives, things can get messy. People start gaming the system. When a KPI becomes the sole focus because it’s tied to a bonus or reward, it often misses the bigger picture and may even encourage counterproductive behavior. Tips: Use a Balanced Scorecard: Include a variety of KPIs in performance evaluations to ensure that no single metric dominates. For example, balance financial metrics with customer satisfaction and operational efficiency. Incorporate Qualitative Metrics: Pair quantitative KPIs with qualitative feedback to ensure that employees are incentivized to think about the bigger picture. For example, sales teams might be measured on both revenue and customer feedback to ensure a balanced approach. Avoid Short-Term Focus: Design KPIs and incentives that encourage long-term thinking. For instance, incentivize customer retention or product quality rather than just quarterly revenue numbers. Monitor for Unintended Consequences: Regularly assess whether the incentive structures are leading to gaming of the system or other counterproductive behaviors. If so, adjust the KPI mix to better reflect holistic success. 5. Letting KPIs Go Stale The Problem: KPIs are not set-and-forget metrics. Yet, many companies treat them like family heirlooms, never to be touched or adjusted. But just like that ancient fruitcake Aunt Martha sends every Christmas, KPIs can go stale if they’re not regularly revisited and refreshed. Business evolves, markets change, and so should your KPIs. Tips: Schedule Regular KPI Reviews: Set up a recurring schedule to review your KPIs—at least once a year, but ideally quarterly. During these reviews, assess whether each KPI is still providing value and relevance to your current strategy. Use Feedback Loops: Solicit feedback from teams on the ground to identify whether KPIs are still driving the right actions. Teams working directly with the data will have insights into which metrics are useful and which have become outdated. Replace or Refresh Outdated KPIs: Don’t hesitate to drop KPIs that no longer serve a purpose. Replace them with new metrics that better reflect your current objectives and market conditions. Adjust Targets as Necessary: KPIs often start as educated guesses. As more data becomes available, recalibrate targets to ensure they are both challenging and realistic, reflecting current business circumstances. => Final Thoughts: Cut the Noise, Amplify the Strategy KPIs are there to guide you, but too many, or the wrong ones, are just static on the line. If your dashboard is crammed with meaningless metrics, it’s time for a refresh. Less is more when it comes to KPIs. Prioritize simplicity, relevance, and actionability. The right KPIs won’t just measure success—they’ll help drive it. So, clear the noise, focus on the signals that matter and let your strategy sing. Source: https://www.jeffwinterinsights.com/insights/dashboard-overload

Source: Credits to Jeff Winter
Dashboard Overload
ZVENIA Mining
Corporate at ZVENIA 02/09/2024

100 KPIs for Project Managers

Most people think KPIs are just numbers. But the truth is, KPIs drive success. • We use them to guide decisions. • We use them to measure progress. • We use them to motivate teams. • We use them to grow our businesses. • We use them to achieve our goals. So we can tell ourselves: "KPIs don’t matter." Or we can learn to use them effectively. I’ve compiled "100 KPIs for Project Managers." It’s packed with metrics to help you navigate your projects. But it’s up to you to turn them into impact. Master the tool we all rely on every day: KPIs.

Source: Credits to Justin Bateh
100 KPIs for Project Managers
ZVENIA Mining
Corporate at ZVENIA 16/03/2024

Learn how to prepare a Performance Dashboard (76 pages)

DM me for an Inquiry of "Power BI Course". It is specially designed for Civil Engineers/Project Management Professionals. Huge Credit to: Wayne W. Eckerson / tdwi -------------------------------------------------- I share my learning journey into data science (Excel, PowerBi, Python, VBA) with my LinkedIn family. Kindly follow me 👉Mitesh Bhatt and let's grow together!

Source: Credits to Mitesh Bhatt
ZVENIA Mining
Corporate at ZVENIA 15/03/2024

170+ KPIs for all the departments (18 pages)

Every Analyst must be familiar with them. I hope this is helpful to you. Do follow Varun Soni for more quality content. source: Qlik Varun Soni Mitesh Bhatt

Source: Credits to Varun Soni

Preview of ZVENIA Mining

Sign up to get unlimited content. No credit card needed.

Sign Up Free