Posts Header

23 Maintenance

Covers equipment maintenance, availability, reliability, and asset management.

Articles on preventive maintenance, fleet availability, tires, oils, and tools.

MTBF O MTTF - ¿CUÁL DEBES MEDIR?

Un problema muy frecuente es la confusión entre el tiempo medio entre fallas (MTBF: Mean Time Between Failures) y el tiempo medio para fallar (MTTF: Mean Time To Failure). Ambos conceptos se originan como parte del desarrollo del análisis RAM. El MTBF se utiliza para equipos reparables, es decir, es típicamente parte de un modelo que asume que el equipo que ha fallado se repara inmediatamente (el tiempo de reparación es cero) como parte de un proceso de renovación. En cambio, el MTTF se utiliza para equipos no reparables, es decir, mide el tiempo medio entre fallas con la suposición de un modelo en que el sistema que ha fallado no se repara. Para un análisis RAM, ambos conceptos, MTBF y MTTF, representan una misma variable que evalúa el tiempo promedio entre fallas, cuyo valor inverso representa la tasa de fallas que es un indicador directo de la confiabilidad.

Source: Credit to José Contreras Márquez
Like
2
ZVENIA Mining
Corporate at ZVENIA 03/03/2026

One Page, Three Machines, Zero Surprises: The Maintenance Dashboard Every Plant Needs

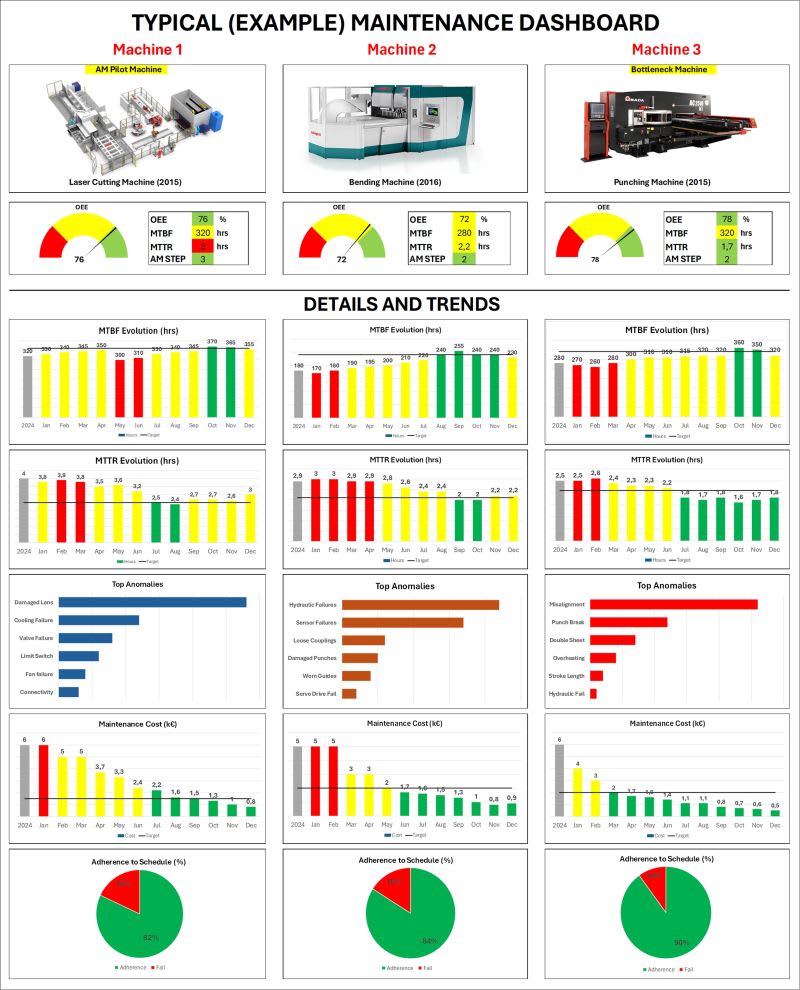
In many plants, maintenance is still managed through gut feeling, scattered files, or conversations at the coffee machine. When a critical machine stops, everyone suddenly realises how blind they actually are. That is why a simple, visual maintenance dashboard (like the example below for fictitious 3 machines) can be a real game changer. Here is what a good Maintenance Dashboard does for you: ✅ Connects reliability with business impact MTBF, MTTR, OEE and maintenance cost on one page show how technical problems translate into lost capacity, overtime and margin. It becomes much easier to argue for spare parts, upgrades or extra headcount when the data is visible and trend-based. ✅Makes problems obvious – every day Monthly trends of MTBF/MTTR, top 5 anomalies for each machine and adherence to schedule turn “we have many breakdowns” into a clear story: where they happen, how often and whether we are getting better or worse. People stop debating opinions and start attacking the real causes. ✅Drives discipline in preventive and autonomous maintenance When adherence to plan is on the dashboard, missed PMs and AM tasks are no longer invisible. Teams see immediately if they are protecting the bottleneck machine or running it to failure. That transparency builds a culture where planning and execution really matter. ✅Prioritises where to act first Instead of spreading resources thin, you quickly identify the pilot machine, the bottleneck and the “silent killers”. A focused Kaizen Study on the worst MTBF, or faster AM Progress on the top breakdown machine, becomes an obvious next step – not a guess. ✅ Creates common language between Production, Maintenance and Management With one page, everyone can align on the same facts: targets, gaps and actions. This is what turns daily meetings from status updates into true decision forums. You do not need a complex system to start. An Excel / Power BI dashboard with 3–5 core KPIs per machine, a simple Pareto of breakdowns and a cost trend is enough to change behaviour. If you are leading a factory, ask yourself: Can my team see, in 5 minutes, the “health status” of our critical machines? If not, a basic maintenance dashboard might be your fastest win this year.

Source: Credit to Alper Ozel
One Page, Three Machines, Zero Surprises: The Maintenance Dashboard Every Plant Needs
ZVENIA Mining
Corporate at ZVENIA 09/10/2025

Hydraulic Accumulators (13 pages)

Hydraulic Accumulators – The Hidden Power Behind System Reliability In every hydraulic system, there’s an unsung hero that ensures smooth performance, energy efficiency, and safety — the hydraulic accumulator. Whether it’s storing energy, absorbing shocks, or providing emergency power, accumulators play a crucial role in keeping systems stable and responsive. There are three main types: ⚙️ Weight-loaded – delivers constant pressure but is bulky. ⚙️ Spring-loaded – simple but limited by spring elasticity. ⚙️ Gas-charged (Piston, Bladder, Diaphragm) – the most widely used for their compactness, quick response, and efficiency. 💡 Applications go far beyond energy storage: • Safety systems in aircraft and railways ✈️🚆 • Energy saving in injection molding machines • Suspension and vibration damping in heavy vehicles 🚜 • Pressure stabilization in pumps and hydraulic circuits By using accumulators smartly, engineers can reduce pump load, save energy, and extend equipment life — all while maintaining system stability. 🔹 Small component, massive impact on system performance.

Source: Credit to Ahmed Mostafa
Allan Inapi
Maintenance Advisor at AJ's Consultancy Services 09/07/2025

Not All Maintenance Notifications Are Urgent or Emergencies!

Maintenance teams and management must stop treating every notification as an emergency. Prioritizing work based on risk is critical for efficient operations. Here's a simple framework to assess the "likelihood", "severity", and "impact" to Safety, Health, Environment (SHE) and Business/Production if a maintenance job/task remains incomplete within 2, 7, 30, 90, 180, or 365 days: 🚧 2 Days: - Likelihood: SHE: Low | Business/Production: Low - Severity: SHE: Minor | Business/Production: Minor - Impact: Slight safety or environmental risk; minimal operational hiccups. 🚧 7 Days: - Likelihood: SHE: Moderate | Business/Production: Moderate - Severity: SHE: Moderate | Business/Production: Moderate - Impact: Possible safety incidents; noticeable production delays. 🚨 30 Days: - Likelihood: SHE: High | Business/Production: High - Severity: SHE: Serious | Business/Production: Serious - Impact: Significant safety or environmental hazards; major workflow disruptions. 🚨 90 Days: - Likelihood: SHE: High | Business/Production: High - Severity: SHE: Severe | Business/Production: Severe - Impact: Critical safety or environmental violations; substantial production losses. 🚨 180 Days: - Likelihood: SHE: Very High | Business/Production: Very High - Severity: SHE: Critical | Business/Production: Critical - Impact: Severe safety or environmental damage; extended operational downtime. 🚨 365 Days: - Likelihood: SHE: Very High | Business/Production: Very High - Severity: SHE: Catastrophic | Business/Production: Catastrophic - Impact: Devastating safety or environmental harm; massive financial and operational setbacks. Set correct End Dates in the notifications so work order backlog is easily managed. Also having a risk category applied/configured in the notification can help with Planning, Scheduling and Execution stages where the IW38/IW37N report can have a column for the risk category. Planners and schedulers can filter by End Dates, Risk category and streamline their activities to ensure the execution teams have the right jobs in the weekly schedule. 💡Takeaway: Implement a risk-based approach to prioritize maintenance notifications. This ensures resources are allocated effectively, protecting SHE and minimizing business disruptions. Let’s work smarter, not harder!

Not All Maintenance Notifications Are Urgent or Emergencies!
ZVENIA Mining
Corporate at ZVENIA 18/06/2025

5-WHY ROOT CAUSE ANALYSIS (RCA)

Problem Statement: A batch of parts was rejected due to an oversized hole diameter. 5-Why Analysis: 1.Why was the batch rejected?→ Because the hole diameter was larger than the specified tolerance. 2.Why was the hole diameter too large?→ Because the drilling machine was not properly adjusted. 3.Why was the machine not properly adjusted?→ Because the operator used an outdated setup sheet. 4.Why did the operator use an outdated setup sheet?→ Because the latest revision was not available at the machine. 5.Why was the latest revision not available at the machine?→ Because there is no system in place to ensure controlled document distribution. Root Cause: No document control system for distributing updated setup sheets. Corrective Actions: •Introduce a document control procedure to issue and display the latest revision only. •Restrict access to outdated setup sheets by removing old versions from machines. •Train machine operators and line leaders on verifying document revision before setup. Preventive Measures: •Digitize all setup sheets with access through a centralized network folder or MES (Manufacturing Execution System). •Implement revision control logs with sign-off for updates and acknowledgments by operators. •Conduct regular audits on setup documents at workstations. •Establish standard work that includes a revision check step before every job setup. •Integrate barcode or QR code scanning to verify correct document versions at machines.

Source: Credit to Poonath Sekar
5-WHY ROOT CAUSE ANALYSIS (RCA)
Fattouch Ridha
Responsable Maintenance at Cérès céramics 26/05/2025

Maintenance niveau zéro

L'article d'aujourd'hui c'est la maintenance premier niveau (maintenance niveau zéro). 🌟Qu’est-ce que ? 🛠️ C'est la maintenance de première ligne Les opérateurs🧑‍🔧 où les conducteurs 🧑‍🔧🧑‍🔧des lignes qui utilisent les machines quotidiennement , sont formés et responsabilisés pour effectuer des tâches de maintenance simples telques : 🔸🔹L'Inspection visuelle👁️ : Vérifier l’état général de la machine, repérer des fuites... 🔸🔹 Nettoyage des machines🧴🧹 : Éliminer la poussière, la saleté ou les débris qui peuvent affecter le fonctionnement des équipements. 🔸🔹Lubrification🛢️ : Appliquer les lubrifiants appropriés aux endroits indiqués, en respectant les fréquences d’intervention. 🔸🔹 Vérification des fixations🔩 : S’assurer que les boulons et autres fixations mécaniques sont bien serrés. 🔸🔹Communication des anomalies📣 : Transmettre aux équipes de maintenance les informations sur les dysfonctionnements identifiés, pour permettre une intervention rapide et efficace. 🌟 Quel est son rôle ? Elle consiste à impliquer directement les opérateurs dans l’entretien de base des machines. 🌟 Pour Quoi ? 🔸 Réduire📉 les temps d'arrêt. 🔸 Impliquer et responsabiliser les opérateurs dans chaîne de production . 🔸 Réduire le coût📉 de la maintenance. 🔸 Améliorer la sécurité 🚨des équipements. La maintenance de première ligne, une approche gagnante 🏆

Maintenance niveau zéro
ZVENIA Mining
Corporate at ZVENIA 17/05/2025

Índice de Intensidad de Mantenimiento

El KPI olvidado que podría transformar la estrategia de mantenimiento: IM (Índice de Intensidad de Mantenimiento) Dentro de mis años de experiencia sólo una vez escuché sobre este indicador y no precisamente estaba dentro de las métricas de medición de la compañía. En la industria hablamos constantemente de MTBF, MTTR, backlog o disponibilidad. Son indicadores esenciales en mantenimiento, sin duda. Pero hay uno que suele quedar en la sombra y que, bien interpretado, puede revelar verdades profundas sobre nuestra gestión: el Índice de Intensidad de Mantenimiento (IM). ¿Qué es el IM? El IM se calcula como: IM = Horas de mantenimiento / Horas de operación Este indicador refleja cuánto esfuerzo real en mantenimiento (en horas-hombre o de máquina) requiere un activo para mantenerse operativo. Es decir, cuánta "intensidad" debemos aplicar para que el sistema funcione. ¿Por qué es tan valioso? Hace visible lo invisible: Muchos equipos parecen confiables porque no fallan, pero requieren constantes ajustes, limpiezas, calibraciones o intervenciones menores. El IM captura ese esfuerzo que no siempre se refleja en las fallas. Detecta desgaste encubierto: Si un activo aumenta su IM sin fallar más, probablemente está envejeciendo o está siendo sobrecargado silenciosamente. Permite comparaciones más justas: No basta con saber si algo falla o no. Dos líneas de producción pueden tener el mismo MTBF, pero una requiere el doble de horas de mantenimiento. ¿Cuál es más eficiente realmente? ¿Por qué casi nadie lo usa? Porque exige registros detallados y sistemáticos de horas de mantenimiento, algo que no todas las empresas hacen bien. Porque no es glamoroso ni fácil de interpretar si no se contextualiza. Porque aún priorizamos la reacción por sobre la comprensión estructural de los activos. A lo que quiero llegar es que el IM no reemplaza a los grandes KPIs, pero los puede complementar con una mirada crítica y estructural. En un entorno donde buscamos eficiencia, sostenibilidad y optimización, no podemos darnos el lujo de ignorar cuánta intensidad estamos aplicando para mantener nuestro sistema en marcha. Quizás es hora de poner este KPI olvidado en el centro de la conversación. Los escucho.

Source: Credit to Jimmy José J.
Índice de Intensidad de Mantenimiento
Luis Bastidas
Ingeniero Mecánico at EduIntelligence Academy 15/05/2025

Gestión Efectiva de Equipos Mineros: Uso de Indicadores y Herramientas Visuales para Mejorar la Productividad

En la industria minera, es fundamental calcular diversos indicadores para optimizar la gestión y el rendimiento de los equipos. Estos indicadores permiten tomar decisiones informadas, mejorar la eficiencia operativa y reducir costos asociados a fallas y tiempos de inactividad. Por ejemplo, uno de los indicadores clave es la Disponibilidad, que nos ayuda a determinar qué porcentaje del tiempo los equipos están operativos y listos para su uso. Esto facilita identificar oportunidades para mejorar la eficiencia y reducir los periodos en los que los equipos permanecen inactivos. Otro indicador importante es el Tiempo fuera de servicio (TFS), que mide cuánto tiempo permanecen los equipos inactivos debido a mantenimiento, fallas o reparaciones. Con esta información, se puede planificar mejor las actividades de mantenimiento y reducir las paradas no programadas, optimizando así la producción. Asimismo, para evaluar la efectividad de las acciones de mantenimiento, calculamos el Porcentaje de Mantenimiento Preventivo. Este indicador nos permite conocer qué proporción del mantenimiento realizado es preventivo, con el objetivo de reducir fallas inesperadas y prolongar la vida útil de los equipos. Por último, para entender mejor las causas de las fallas, es útil clasificar los tipos de fallas mediante diagramas de dispersión logarítmica. Esto nos permite graficar los equipos junto con sus fallas, ya sea leves, agudas, críticas o crónicas, facilitando así el enfoque en acciones correctivas y preventivas más efectivas. Parte de estos conceptos y herramientas se abordarán en un curso especialmente diseñado, donde se presentará un reporte de indicadores de mantenimiento utilizando Power BI aplicado a equipos mineros. La metodología será sencilla y accesible, con la intención de que la herramienta sea fácil de entender y aprovechar, ya que Power BI es muy amigable y poderoso para la visualización de datos. Te comparto más información en el video adjunto. Saludos cordiales, Ingeniero Luis Bastidas Director de EduIntelligence Academy WhatsApp: +584125375083 Email: info@eduintelligenceacademy.com

ZVENIA Mining
Corporate at ZVENIA 29/04/2025

PLANIFICACIÓN, PROGRAMACIÓN Y COSTOS DEL MANTENIMIENTO (5 pages)

El mantenimiento reactivo y el mantenimiento proactivo, no son tipos de mantenimiento. Entonces ¿Que son? En el siguiente artículo podrás encontrar la respuesta. El artículo es tomado de mi libro "PLANIFICACIÓN, PROGRAMACIÓN Y COSTOS DEL MANTENIMIENTO" que podrás adquirir en: https://www.bookdelivery.com/fr-en/books/search?q=Jos%C3%A9+Contreras+M%C3%A1rquez

Source: Credit to José Contreras Márquez

Preview of ZVENIA Mining

Sign up to get unlimited content. No credit card needed.

Sign Up Free